Adding Distributed Tracing to AI Gateway: My LFX Mentorship Journey
Zhengke Zhou
Aug 28, 2025
In today’s rapidly evolving AI application landscape, effectively monitoring and debugging AI Gateways has become a critical challenge. This article shares my complete experience through the LFX Mentorship program, where I added OpenTelemetry distributed tracing support to kgateway’s AI Gateway functionality.
From application strategies for LFX Mentorship to challenges and insights during project implementation, I hope this provides a valuable reference for students who want to participate in open source projects.
My Background and Preparation
Before applying for LFX Mentorship, I had already been exposed to OpenTelemetry during my internship, gaining foundational knowledge in the observability domain. More importantly, I participated in the Jaeger community’s development work to add Clickhouse support for traces (PR #6935), which gave me practical experience with distributed tracing.
These experiences made me feel that the LFX Mentorship project about AI Gateway distributed tracing was an excellent opportunity to deepen my learning and contribute to the open source community.
Application Strategy: Contribute First, Apply Later
I know everyone gets excited when they see a project they’re interested in and can’t wait to apply. But I adopted a different strategy: first deeply understand the project, actively participate in the community, then submit the application.
Deep Product Experience
Instead of rushing to submit my application, I first went to actually experience the product involved in the project: AI Gateway. During usage, I discovered a practical problem - I couldn’t directly access the LLM service providers mentioned in the official guide.
Proactive Problem Solving
I didn’t just report the problem, but proactively proposed a solution. I brought up this issue in the community Slack:

Eventually, I successfully submitted a PR: Allow overriding default LLM provider endpoints, which solved this configuration issue.
Why This Approach Is Important
By contributing code before applying, I achieved several goals:
- Deep project understanding: Truly understood the project’s architecture and pain points
- Building trust: Proved to the mentor that I had the capability to complete project tasks
- Community integration: Established connections with community members in advance
Project Core: Adding Distributed Tracing to AI Gateway
The Problem to Solve
AI Gateway is implemented using Envoy’s extproc functionality, where all requests to LLM service providers are intercepted and processed by the extension program. Currently, AI Gateway has introduced Metrics in the observability domain (Logs, Metrics, Traces). However, when issues occur, Metrics can only tell us ‘What’ happened, but not ‘Where’ the issue occurred, we can only sift through massive amounts of logs for troubleshooting, which is both time-consuming and inefficient.
Distributed tracing can help us:
- Visualize request flow: Clearly see the complete path of requests through the system
- Rapid problem identification: Quickly find issues by querying failed requests (like
attributes.http.status=400) - Performance analysis: Understand latency at various stages
- Monitor LLM calls: Track calls and performance across different LLM service providers
Project Goals
Our goal was to provide complete observability support for AI Gateway:
- Configuration flexibility: Users can configure OpenTelemetry tracer and Span Exporter
- Standardized tracing: Follow OpenTelemetry’s GenAI semantic conventions
- Multi-vendor support: Support multiple LLM service providers like OpenAI, Anthropic, and Gemini
- Ease of use: Provide simple configuration methods and clear documentation
Design Approach
The project was divided into two main parts. For more details, see: EP-11777:
Control Plane: Provides configuration interface through GatewayParameters API, where users can specify tracing backends, sampling rates, and other parameters.
Data Plane: Implements actual distributed tracing logic in the AI extension server, collecting and exporting trace data.
The key challenge was handling response format differences across different LLM service providers. Each provider’s API response structure is different, requiring us to uniformly extract key information such as model names, token usage, response status, etc., and format them according to OpenTelemetry standards.
Important Lessons from the Development Process
Critical Testing Strategy Lessons
Early in the project, I made an important mistake: skipping unit tests and going directly to E2E testing. At the time, I chose to send generated traces directly to Tempo for verification. While installing Tempo and Grafana via Helm was simple, and I could clearly observe trace generation after sending requests to the gateway, this approach became extremely complex when writing automated tests.
The Problems:
- Needed to write complex TraceQL queries to verify data
- TraceQL syntax was difficult to debug, consuming significant time
- Test environment configuration was complex and hard to maintain
Better Solution:
After discussions with my mentor, Nina, I learned that the system already had a simpler method: send traces to OTel Collector and have the Collector output structured logs. This way, we could directly retrieve all traces data from container logs using kubectl logs, greatly simplifying the testing process.
Key Takeaways
- Write unit tests first: Unit tests can verify core logic faster, avoiding debugging in complex integration environments
- Seek help promptly: When encountering difficulties, don’t go down rabbit holes alone - mentor experience can help you avoid detours
- Understand existing tools: Fully understand the project’s existing testing tools and methods to avoid reinventing the wheel
Community Collaboration
Throughout the development process, support from the kgateway community was crucial. Whether for technical discussions or code review feedback, community members were always very helpful. This gave me a deep appreciation for the collaborative spirit of open source projects.
Project Results and Value
Implemented Features
Through this project, we added complete distributed tracing support to kgateway’s AI Gateway:
- Unified configuration interface: Users can easily configure distributed tracing through GatewayParameters
- Multi-vendor support: Support for mainstream LLM service providers like OpenAI, Anthropic, and Gemini
- Standardized tracing: Follows OpenTelemetry GenAI semantic conventions
- Flexible deployment: Supports sending to any OTLP-compatible backend storage
How to Experience the Distributed Tracing Feature
Want to experience this distributed tracing feature yourself? Follow these steps to quickly set up a complete test environment:
1. Install Gateway
Follow the Get started guide. For the installation, choose the development version, v2.3.0-main.
2. Enable AI Extension
As you follow the Set up AI Gateway, note the following configurations:
Upgrade kgateway and enable AI Gateway extension:
helm upgrade -i -n kgateway-system kgateway oci://cr.kgateway.dev/kgateway-dev/charts/kgateway \
    --set gateway.aiExtension.enabled=true \
    --version v2.1.0-main
Create GatewayParameters resource with distributed tracing configuration:
kubectl apply -f- <<EOF
apiVersion: gateway.kgateway.dev/v1alpha1
kind: GatewayParameters
metadata:
  name: ai-gateway
  namespace: kgateway-system
spec:
  kube:
    aiExtension:
      enabled: true
      ports:
        - name: ai-monitoring
          containerPort: 9092
      tracing:
        endpoint: "http://opentelemetry-collector-traces.telemetry:4317"
        sampler:
          type: "alwaysOn"
      env:
        - name: LOG_LEVEL
          value: DEBUG
    service:
      type: NodePort
EOF
3. Deploy OTel Stack
We only need the traces components. If you need other features (logs, metrics), please refer to: OTel Stack
Install Tempo:
helm upgrade --install tempo tempo \
  --repo https://grafana.github.io/helm-charts \
  --version 1.16.0 \
  --namespace telemetry \
  --create-namespace \
  --values - <<EOF
persistence:
  enabled: false
tempo:
  receivers:
    otlp:
      protocols:
        grpc:
          endpoint: 0.0.0.0:4317
EOF
Install OTel Collector:
helm upgrade --install opentelemetry-collector-traces opentelemetry-collector \
  --repo https://open-telemetry.github.io/opentelemetry-helm-charts \
  --version 0.127.2 \
  --set mode=deployment \
  --set image.repository="otel/opentelemetry-collector-contrib" \
  --set command.name="otelcol-contrib" \
  --namespace=telemetry \
  --create-namespace \
  -f -<<EOF
config:
  receivers:
    otlp:
      protocols:
        grpc:
          endpoint: 0.0.0.0:4317
        http:
          endpoint: 0.0.0.0:4318
  exporters:
    otlp/tempo:
      endpoint: http://tempo.telemetry.svc.cluster.local:4317
      tls:
        insecure: true
    debug:
      verbosity: detailed
  service:
    pipelines:
      traces:
        receivers: [otlp]
        processors: [batch]
        exporters: [debug, otlp/tempo]
EOF
Configure Grafana for more intuitive trace observation
Install Grafana using deploy-grafana-using-helm-charts.
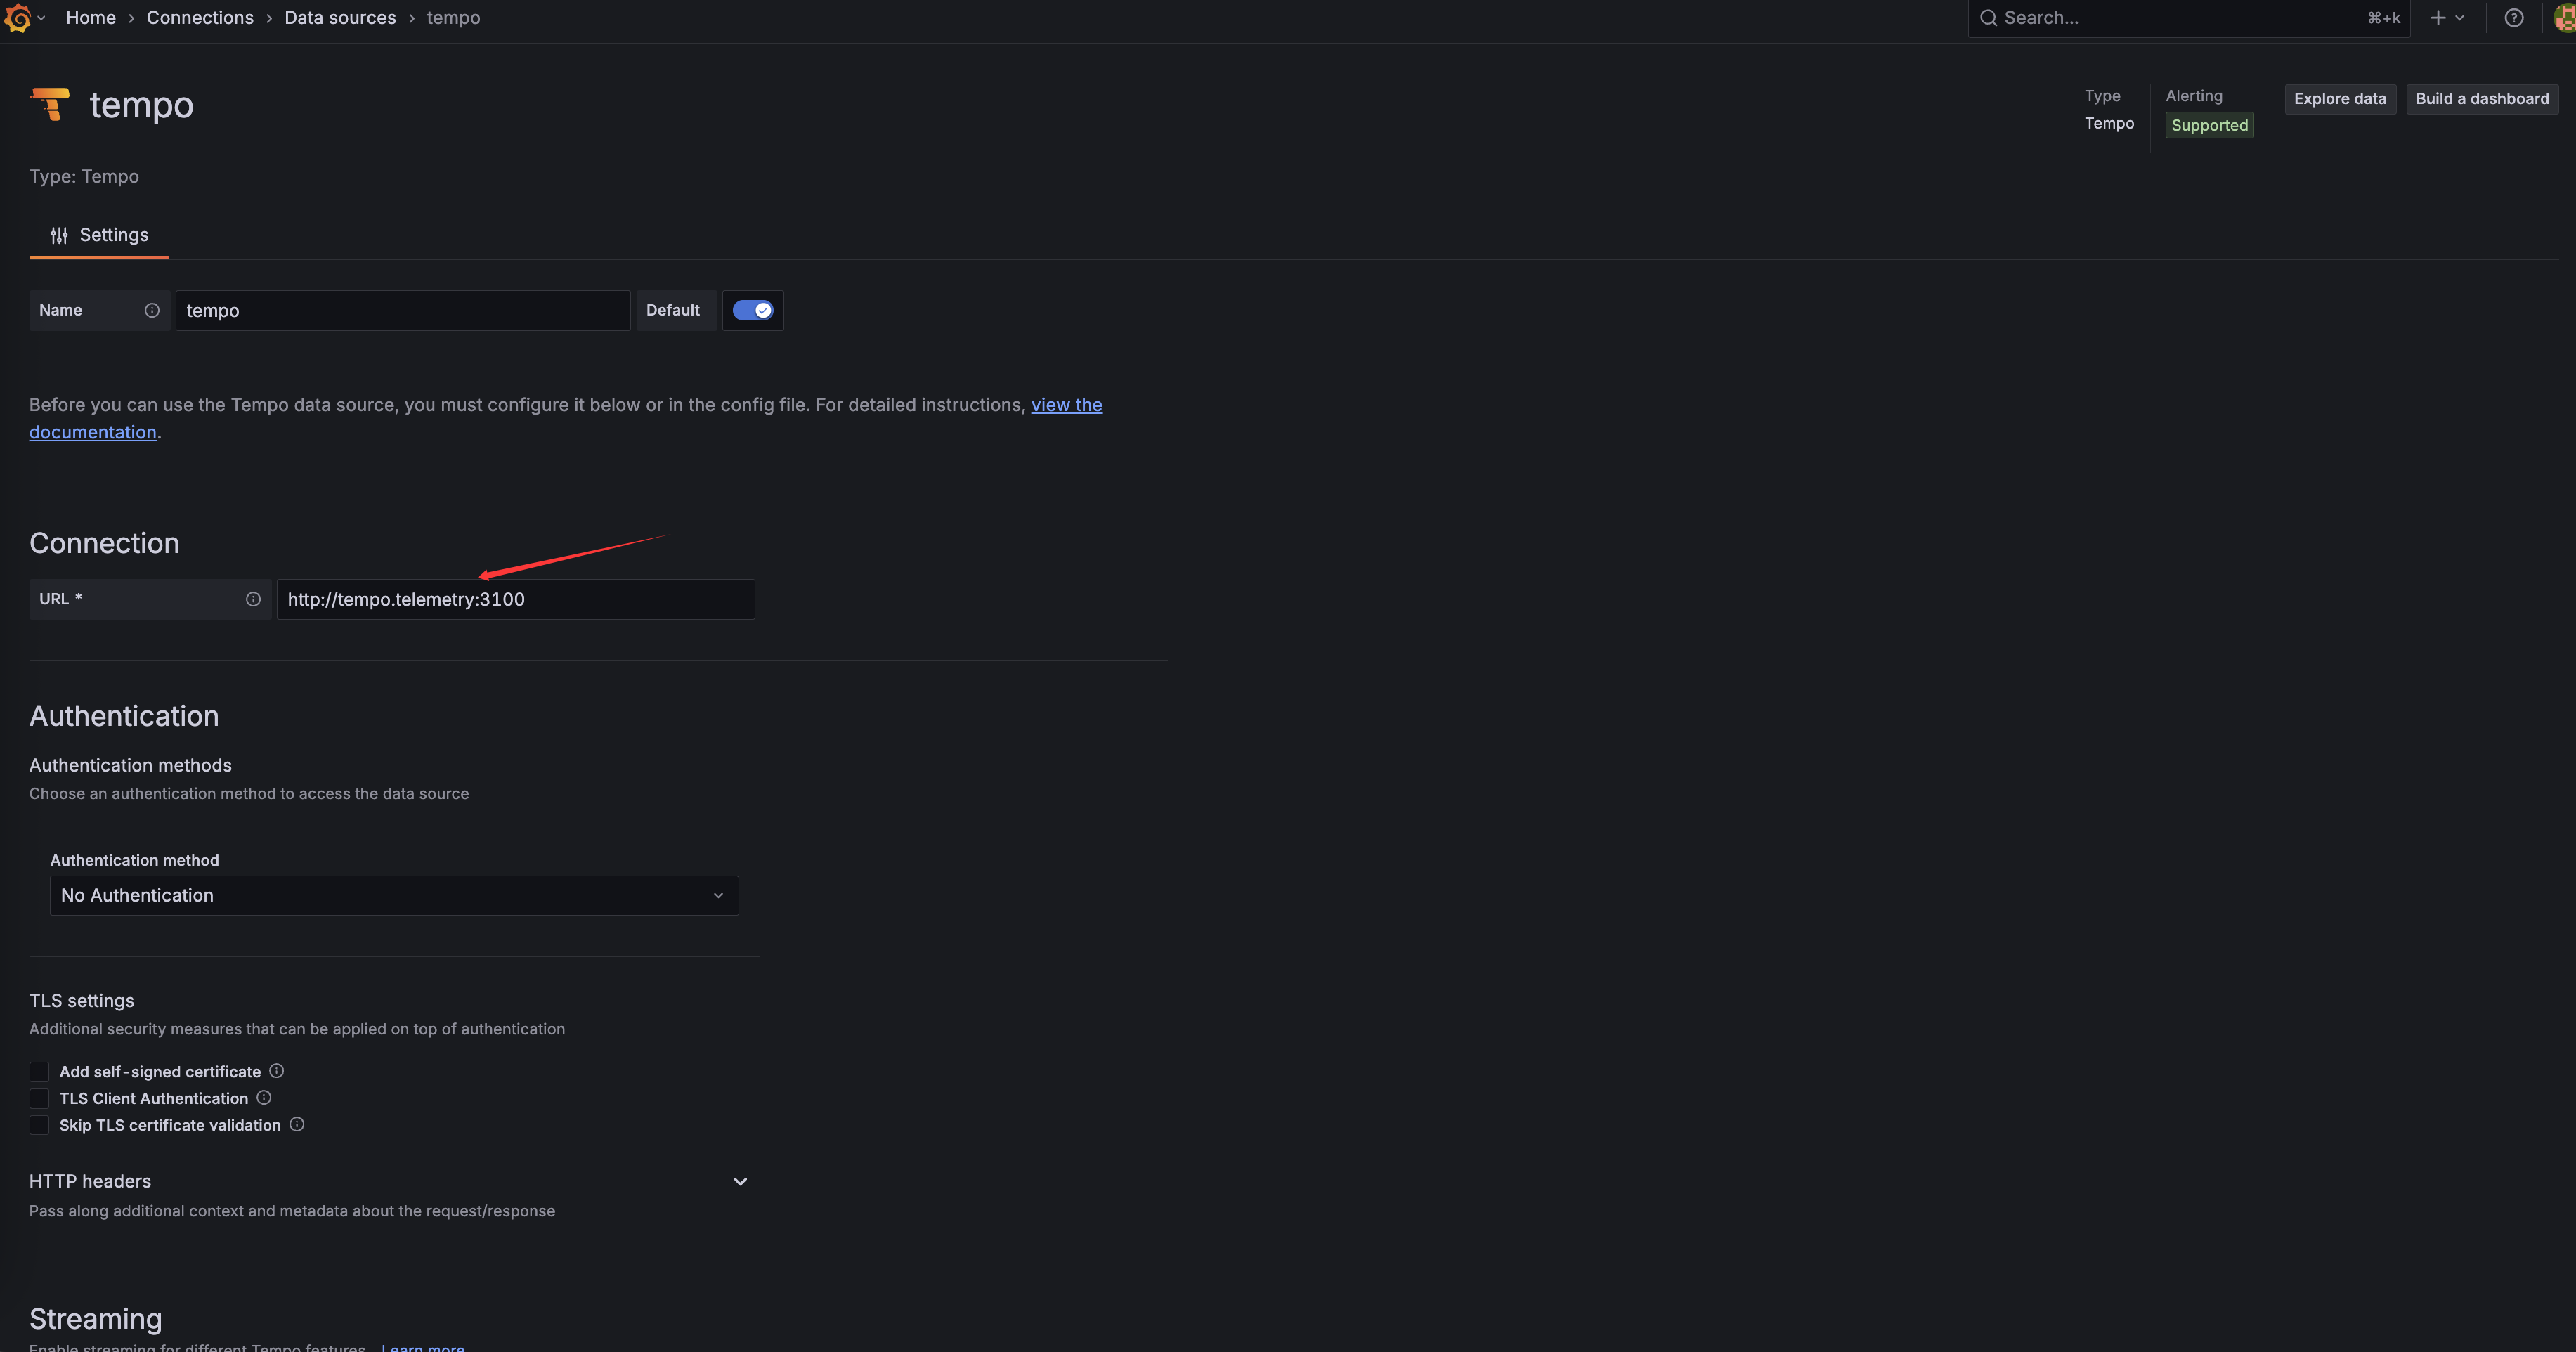
Configure Tempo as a data source, and fill in the URL field with: http://tempo.telemetry:3100

4. Create Tracing Policy
kubectl apply -f- <<EOF
apiVersion: gateway.kgateway.dev/v1alpha1
kind: HTTPListenerPolicy
metadata:
  name: tracing-policy
  namespace: kgateway-system
spec:
  targetRefs:
    - group: gateway.networking.k8s.io
      kind: Gateway
      name: ai-gateway
  tracing:
    provider:
      openTelemetry:
        serviceName: http
        grpcService:
          backendRef:
            name: otel-collector-traces
            namespace: telemetry
            port: 4317
    spawnUpstreamSpan: true
EOF
5. Send Test Request
Send a test request using Ollama for local LLMs:
curl -v "localhost:8080/ollama" \
    -H "Content-Type: application/json" \
    -d '{
        "model": "llama3.2",
        "messages": [
            {
                "role": "system",
                "content": "You are a helpful assistant."
            },
            {
                "role": "user",
                "content": "Hello!"
            }
        ]
    }' | jq
6. Verify Distributed Tracing
Check if traces are being collected properly via command line:
kubectl -n telemetry logs deploy/opentelemetry-collector-traces | grep 'llama'You should see output similar to this:
Name           : gen_ai.request generate_content llama3.2
    -> gen_ai.request.model: Str(llama3.2)
    -> gen_ai.response.model: Str(llama3.2)
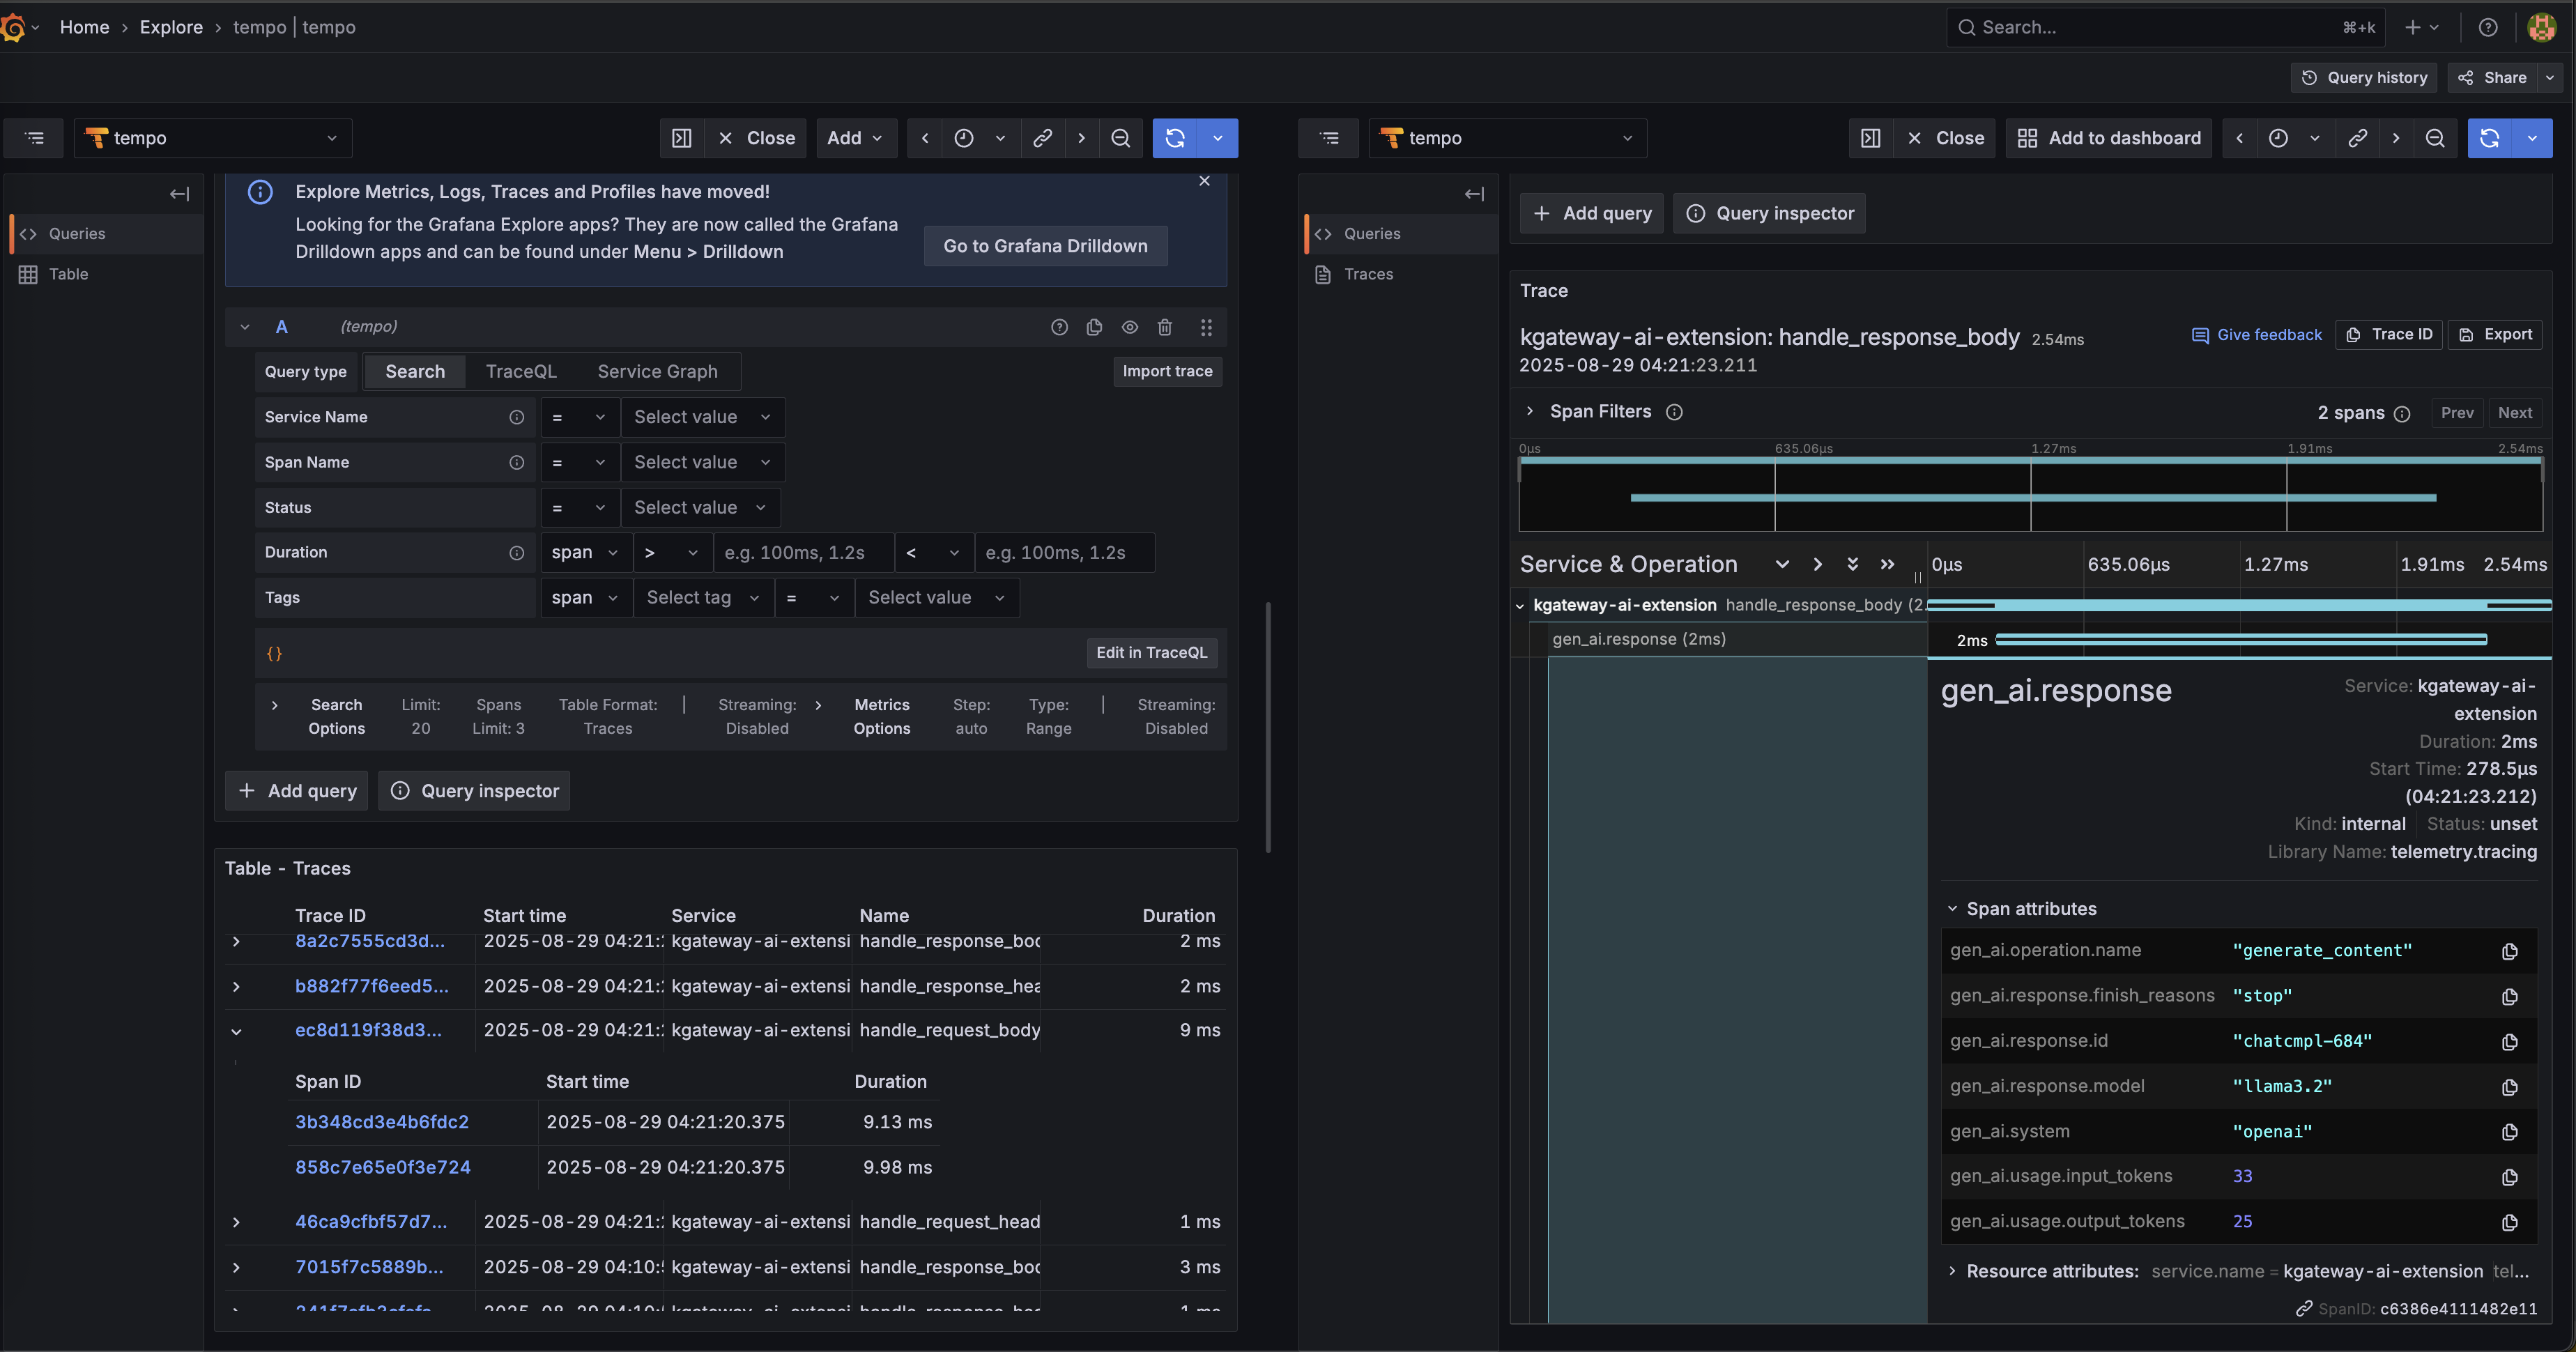
Observe traces more intuitively through Grafana:

This indicates that the distributed tracing feature is working properly, and your AI Gateway requests are being completely traced and recorded!
Personal Gains
Through LFX Mentorship, I not only completed a meaningful technical project, but more importantly:
- Deep open source participation: Transformed from a user to a contributor, deeply understanding how open source projects operate
- Technical skill improvement: Gained deeper understanding in distributed tracing, AI Gateway architecture, and other areas
- Enhanced collaboration skills: Learned how to communicate and collaborate effectively in international teams
Advice for Students Who Want to Participate in Open Source
LFX Mentorship Application Strategy
- Prepare in advance: Start following and participating in target projects before applying
- Proactive contribution: Build community trust through small PRs or issue reports
- Deep understanding: Ensure you truly understand the project’s tech stack and business value
- Demonstrate capability: Prove your technical ability with actual code contributions
Project Execution Advice
- Maintain communication: Regularly sync progress and issues with mentors and community
- Incremental approach: Start with small features, gradually building complete solutions
- Value testing: Write unit tests first, then integration tests
- Documentation first: Good documentation helps the community better understand and use your contributions
Conclusion
From applying for LFX Mentorship to completing the AI Gateway distributed tracing project, this experience gave me a deep understanding of the power and value of open source communities. Technology itself is important, but what’s more important is learning how to collaborate with the community, how to solve real problems, and how to create value for a broader user base.
If you’re also interested in open source contribution, why not start today? Find a project you’re interested in and submit your first issue or PR. Every small contribution is a step toward bigger goals.
Finally, special thanks to my mentors @Nina and @Andy for taking their valuable time to guide and help me complete this project!