Debug your setup
Use built-in tools to troubleshoot issues in your kgateway setup.
Kgateway consists of the control plane and an agentgateway data plane. If you experience issues in your environment, such as policies that are not applied or traffic that is not routed correctly, in a lot of cases, these errors can be observed at the proxy.
Debug the control plane
-
Enable port-forwarding on the control plane.
kubectl port-forward deploy/kgateway -n kgateway-system 9095 -
In your browser, open the admin server debugging interface: http://localhost:9095/.
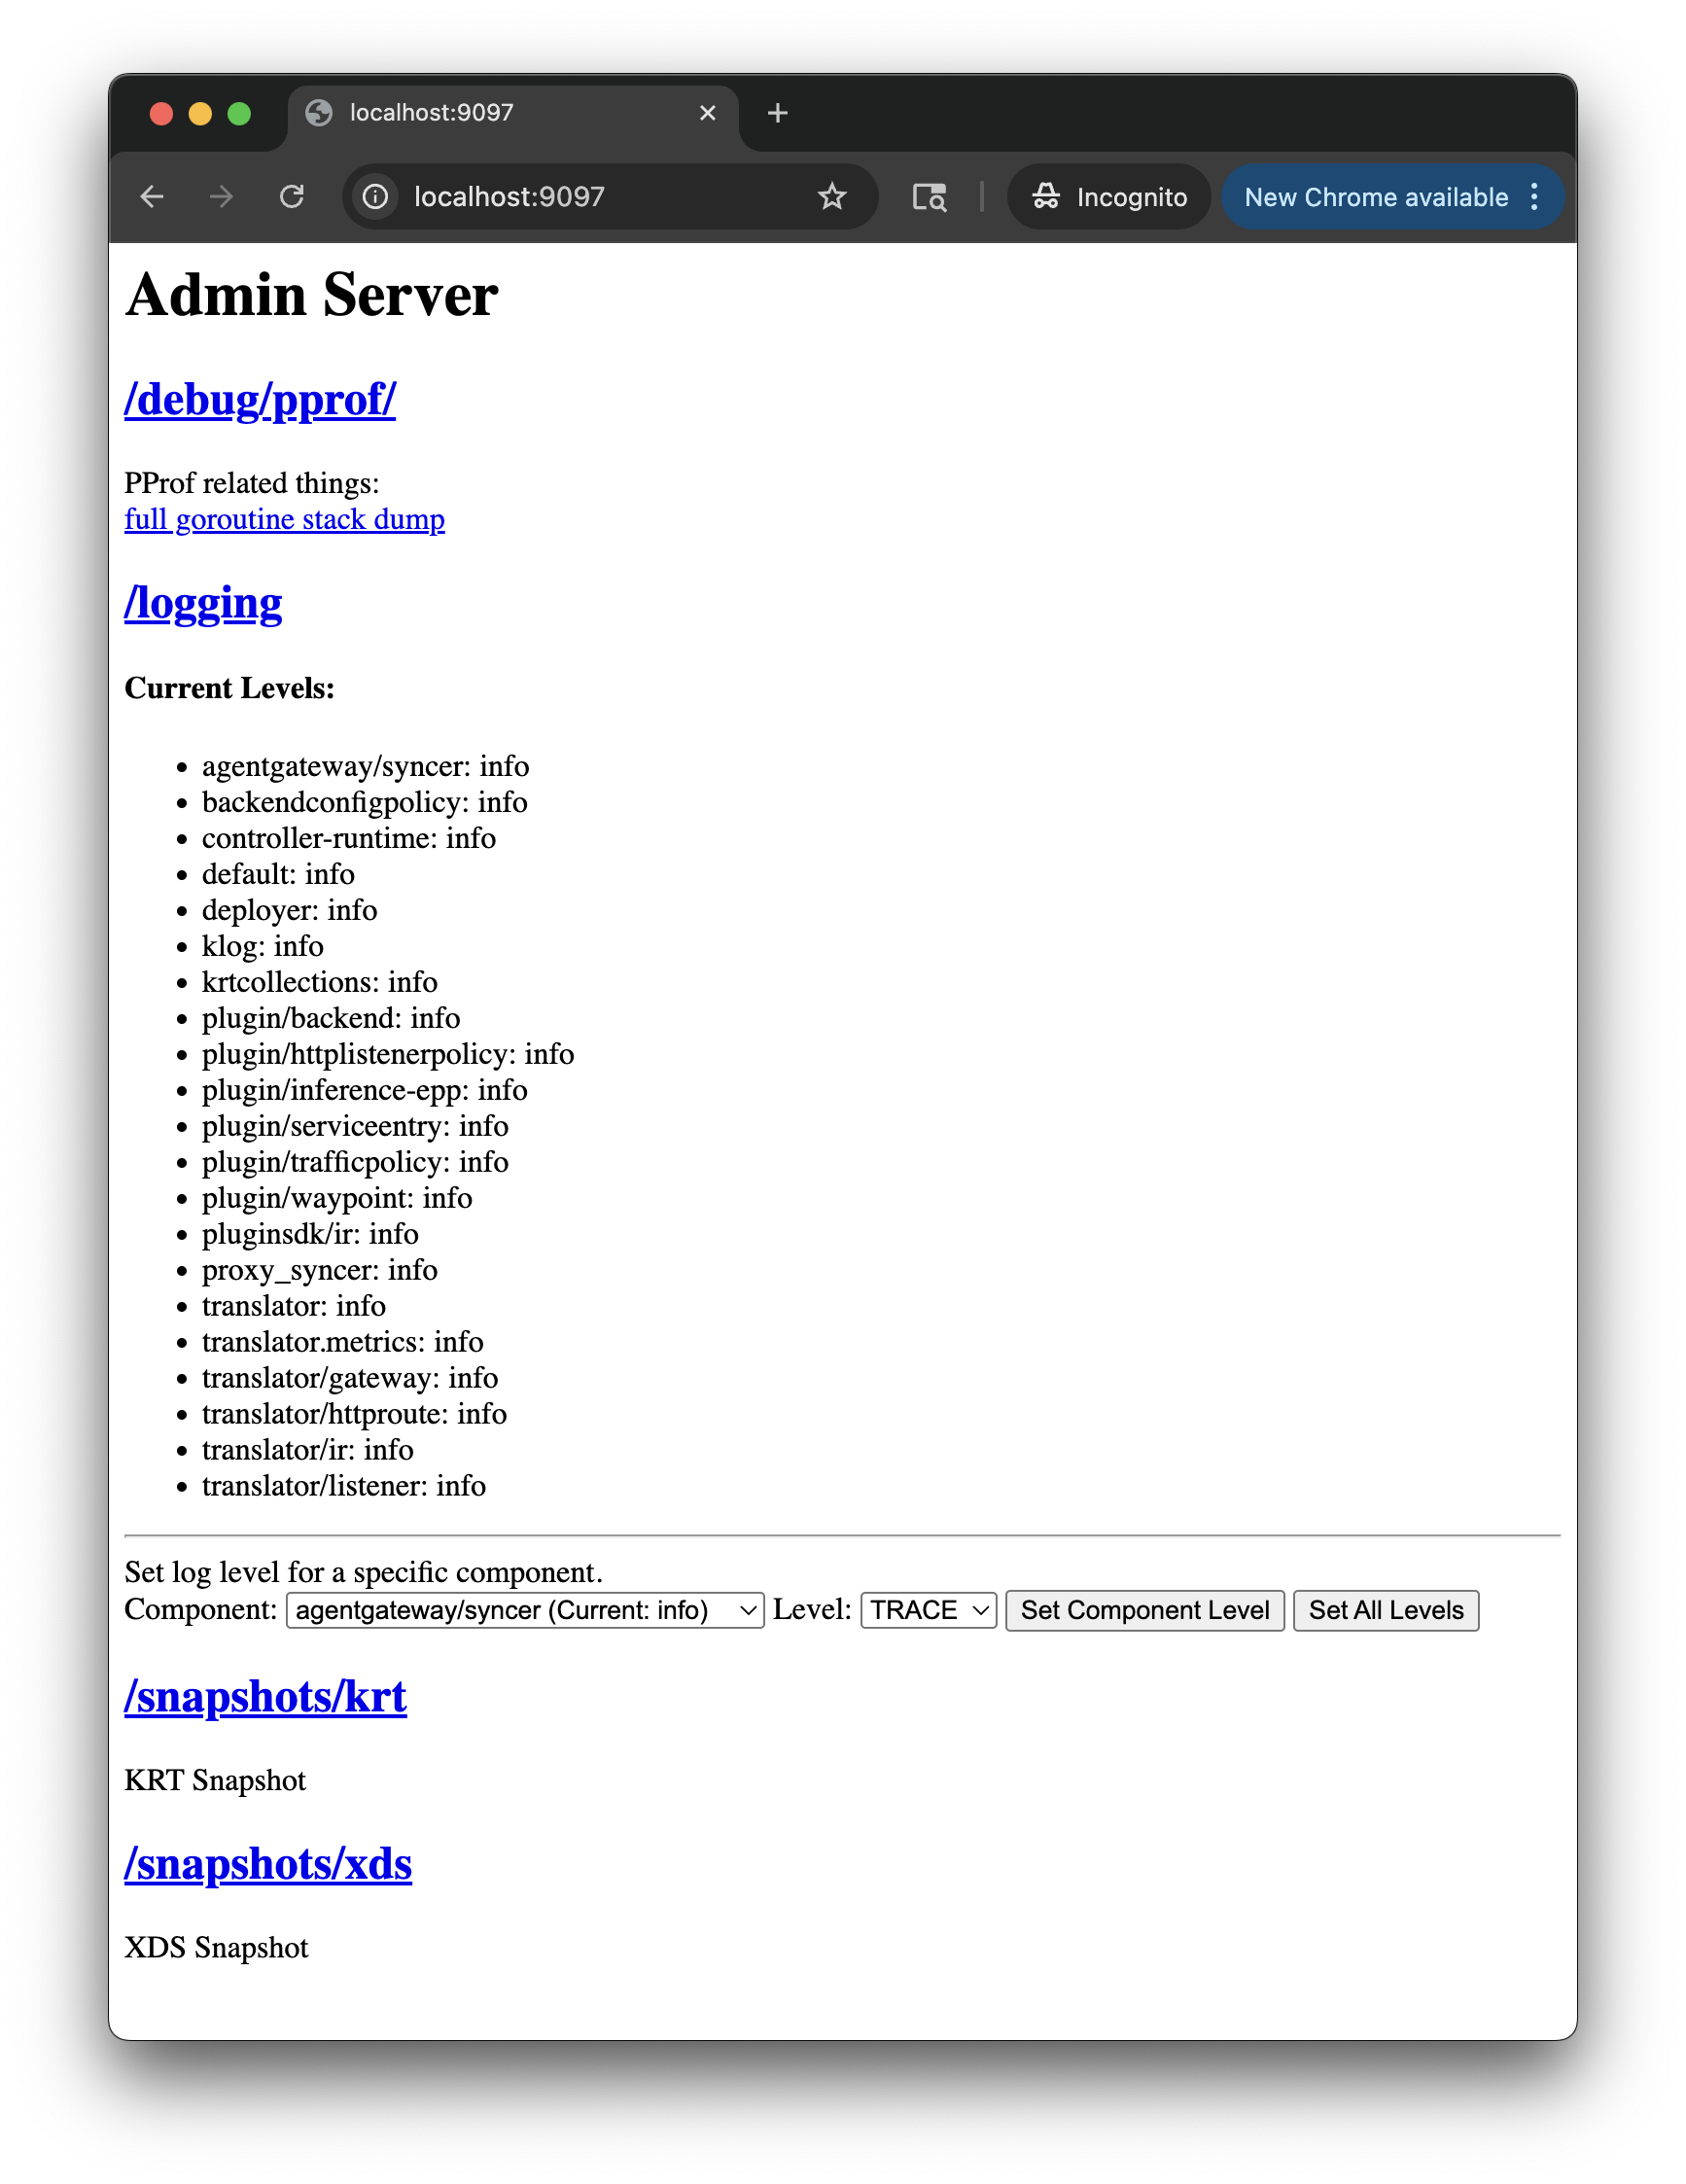
Figure: Admin server debugging interface. Figure: Admin server debugging interface. -
Select one of the endpoints to continue debugging. Review the following table to understand this configuration.
Endpoint Description /debug/pprofView the pprof profile of the control plane. A profile shows you the stack traces of the call sequences, such as Go routines, that led to particular events, such as memory allocation. The endpoint includes descriptions of each available profile. /loggingReview the current logging levels of each component in the control plane. You can also interactively set the log level by component, such as to enable DEBUGlogs./snapshots/krtView the current krt snapshot, or the point-in-time view of the transformed Kubernetes resources and their sync status that the control plane processed. These resources are then used to generate gateway configuration that is sent to the gateway proxies for routing decisions. /snapshots/xdsThe xDS snapshot is used for Envoy-based kgateway proxies, not agentgateway proxies.
Debug your gateway setup
-
Make sure that the kgateway control plane and gateway proxies are running. For any pod that is not running, describe the pod for more details.
kubectl get pods -n kgateway-system -
Check the HTTPRoutes for the status of the route and any attached policies.
kubectl get httproutes -Akubectl get httproute <name> -n <namespace> -o yaml -
Access the debugging interface of your gateway proxy on your localhost. Configuration might be missing on the gateway or might be applied to the wrong route. For example, if you apply multiple policies to the same route by using the
targetRefssection, only the oldest policy is applied. The newer policy configuration might be ignored and not applied to the gateway.kubectl port-forward deploy/agentgateway -n kgateway-system 15000 &Open your browser to the following endpoints.
Endpoint Description http://localhost:15000/config_dump Get the configuration that is available in the agentgateway proxy. Any custom resources that you create are translated in to agentgateway configuration. Depending on whether or not you enabled resource validation, you might have applied invalid configuration that is rejected in agentgateway. http://localhost:15000/ui A read-only user interface to review the agentgateway resources in your environment, such as listeners, routes, backends, and policies. 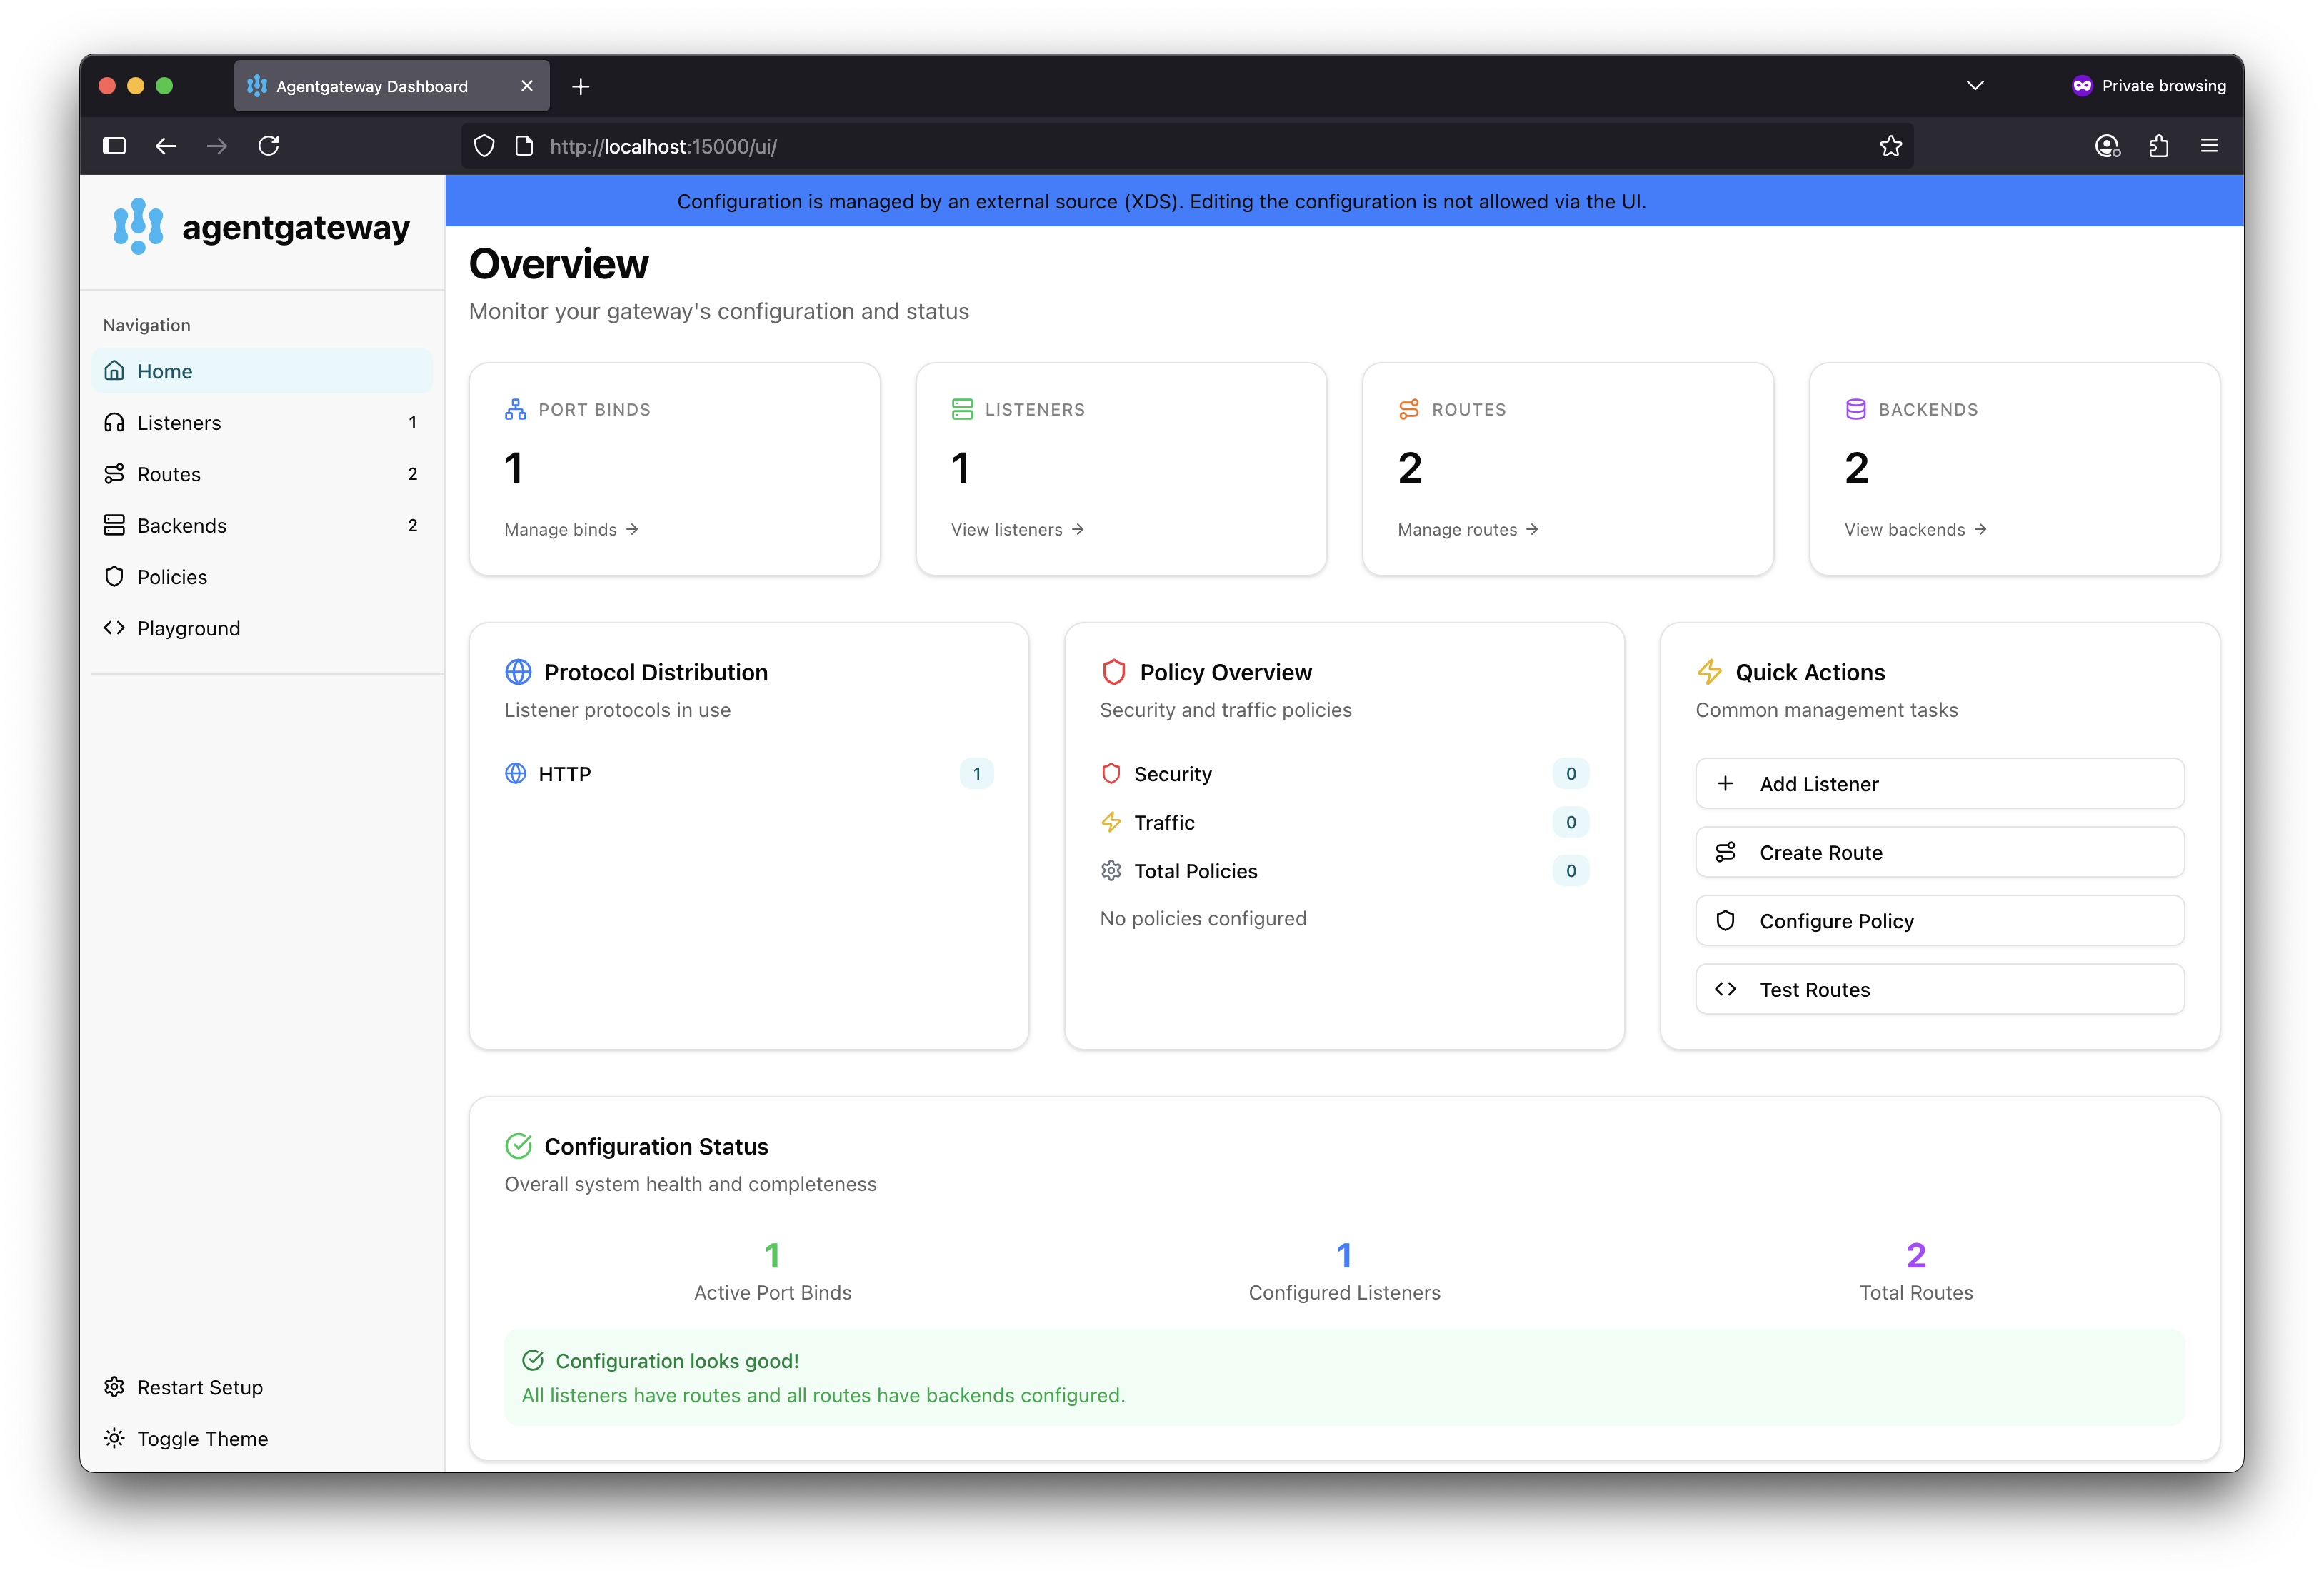
Figure: Read-only agentgateway UI. 
Figure: Read-only agentgateway UI. -
Review the logs for each component. Each component logs the sync loops that it runs, such as syncing with various environment signals like the Kubernetes API.