OTel stack
Deploy an open source observability stack based on OpenTelemetry (OTel) that includes the following components:
- Logs: Centralized log collection and storage with Grafana Loki.
- Traces: Distributed tracing with Grafana Tempo.
- Metrics: Time-series metrics collection with Prometheus.
- Collection: Unified telemetry collection with OpenTelemetry Collector.
- Visualization: Comprehensive dashboards with Grafana.
About
Observability tools are essential to gain insight into the health and performance of your gateway proxies. OpenTelemetry (OTel) is a flexible, open source framework that provides a set of APIs, libraries, and instrumentation to help capture and export observability data. However, you can follow a similar process as this guide to use the tools that you prefer.
Observability data types
Observability is built on three core pillars as described in the following table. By combining these three data types, you get a complete picture of your system’s health and performance.
| Pillar | Description |
|---|---|
| Logs | Discrete events that happen at a specific time with detailed context. |
| Metrics | Numerical measurements aggregated over time intervals. |
| Traces | Records of requests as they flow through distributed systems. |
Architecture
Review the following diagram to understand the architecture of the observability stack.
The gateway proxy acts as the primary telemetry generator, while the OTel Collectors serve as the central routing hub for all observability data.
  flowchart TD
    A["1- Application Traffic"] --> B["2- Gateway proxy"]
    B --> C["3- OTel Collectors"]
    C --> D["4- Storage Backends"]
    D --> D1["Logs (Loki)"]
    D --> D2["Traces (Tempo)"]
    D --> D3["Metrics (Prometheus)"]
    D1 --> E["5- Visualization (Grafana)"]
    D2 --> E
    D3 --> E
Architecture data flow:
- Application Traffic: Applications send requests to the gateway proxy.
- Gateway Processing: The gateway proxy processes requests and generates telemetry data in the form of logs, traces, and metrics.
- Telemetry Collection: The OTel Collectors receive telemetry data from the gateway proxy.
- Data Storage: The OTel Collectors route data to the appropriate storage backends:
- Logs go to Loki for log aggregation and storage.
- Traces go to Tempo for distributed tracing storage.
- Metrics go to Prometheus for time-series metrics storage.
- Visualization: Grafana queries the storage backends as data sources to create unified dashboards.
More considerations
Push model: This guide sets up the OTel collectors to push metrics to the storage backends (push model), vs. setting up the backends such as Prometheus to scrape metrics from the collector pod (pull model). The push model is used because it shows the ease and consistency of using OTel for demonstration purposes. It also supports Native Histograms out of the box, which the pull model does not due to a known OTel issue with the Prometheus exporter.
Debug exporter: The example pipelines in all three OTel collectors set up the debug exporter. This exporter is useful for testing and validation purposes. However, for production scenarios, remove this exporter to avoid performance impacts.
Prometheus exporter: If you prefer the pull model to the push model, you can use prometheusexporter’s promexporter port with Prometheus to scrape metrics from the collector pod, such as configured in the example later. Also, if you use the pull model, make sure to configure Prometheus to handle Native Histograms and scrape the metrics directly as for this model OTel’s prometheusexporter is not yet supported, per the known issue previously mentioned.
Before you begin
-
Follow the Get started guide to install kgateway.
-
Follow the Sample app guide to create a gateway proxy with an HTTP listener and deploy the httpbin sample app.
-
Get the external address of the gateway and save it in an environment variable.
export INGRESS_GW_ADDRESS=$(kubectl get svc -n kgateway-system http -o jsonpath="{.status.loadBalancer.ingress[0]['hostname','ip']}")
echo $INGRESS_GW_ADDRESS
kubectl port-forward deployment/http -n kgateway-system 8080:8080
Step 1: Install Grafana Loki and Tempo
Grafana is a suite of open source tools that help you analyze, visualize, and monitor data in your cluster. For the OTel stack, you install the following Grafana components:
- Loki: A log aggregation system that indexes metadata about your logs as a set of labels, not the actual log contents. This way, Loki is more cost-efficient and performant than traditional log aggregation systems.
Loki works best when you use structured logging in your applications, such as JSON format.
- Tempo: A distributed tracing system that stores trace data in object storage (like Amazon S3) and integrates seamlessly with Grafana for visualization. Distributed tracing helps you see how requests move through a microservices environment, which helps you identify performance bottlenecks, debug issues, and otherwise monitor your system’s health to ensure SLA compliance.
Steps to install:
-
Deploy Grafana Loki to your cluster.
helm upgrade --install loki loki \ --repo https://grafana.github.io/helm-charts \ --version 6.24.0 \ --namespace telemetry \ --create-namespace \ --values - <<EOF loki: commonConfig: replication_factor: 1 schemaConfig: configs: - from: 2024-04-01 store: tsdb object_store: s3 schema: v13 index: prefix: loki_index_ period: 24h auth_enabled: false singleBinary: replicas: 1 minio: enabled: true gateway: enabled: false test: enabled: false monitoring: selfMonitoring: enabled: false grafanaAgent: installOperator: false lokiCanary: enabled: false limits_config: allow_structured_metadata: true memberlist: service: publishNotReadyAddresses: true deploymentMode: SingleBinary backend: replicas: 0 read: replicas: 0 write: replicas: 0 ingester: replicas: 0 querier: replicas: 0 queryFrontend: replicas: 0 queryScheduler: replicas: 0 distributor: replicas: 0 compactor: replicas: 0 indexGateway: replicas: 0 bloomCompactor: replicas: 0 bloomGateway: replicas: 0 EOF -
Deploy Grafana Tempo to your cluster.
helm upgrade --install tempo tempo \ --repo https://grafana.github.io/helm-charts \ --version 1.16.0 \ --namespace telemetry \ --create-namespace \ --values - <<EOF persistence: enabled: false tempo: receivers: otlp: protocols: grpc: endpoint: 0.0.0.0:4317 EOF -
Verify that the Grafana pods are running.
kubectl get pods -n telemetry -l 'app.kubernetes.io/name in (loki,tempo)'Example output:
NAME                   READY   STATUS    RESTARTS   AGE
loki-0                 2/2     Running   0          3m45s
loki-chunks-cache-0    2/2     Running   0          3m45s
loki-results-cache-0   2/2     Running   0          3m45s
tempo-0                1/1     Running   0          2m10s
Step 2: Install the OTel Collector
The OpenTelemetry collector acts as a centralized agent that scrapes metrics from the kgateway control plane and data plane gateway proxies. Then, the OTel collector exposes these metrics in Prometheus format so that other tools in your observability stack, such as Grafana, can in turn scrape the OTel collector and visualize the data.
By using an OTel collector to aggregate metrics, you avoid having to configure each application individually to send their metrics to each backend observability tool. This setup simplifies your setup, lets you more easily change backends, improves reliability and debuggability, and lets you optimize preprocessing activities such as filtering, transforming, or enriching the metrics before scraping.
You can deploy three separate OTel collectors that are optimized for the three different types of telemetry data: metrics, logs, and traces. This way, you can scale and optimize each collector based on your telemetry needs.
debug exporter. This exporter is useful for testing and validation purposes. However, for production scenarios, remove this exporter to avoid performance impacts.-
Deploy the metrics collector to handle numerical measurements and time-series data. Note that you can also use the
promexporterendpoint with Prometheus to scrape metrics from the collector pod, if you prefer thepullmodel to thepushmodel.helm upgrade --install opentelemetry-collector-metrics opentelemetry-collector \ --repo https://open-telemetry.github.io/opentelemetry-helm-charts \ --version 0.127.2 \ --set mode=deployment \ --set image.repository="otel/opentelemetry-collector-contrib" \ --set command.name="otelcol-contrib" \ --namespace=telemetry \ --create-namespace \ -f -<<EOF clusterRole: create: true rules: - apiGroups: - '' resources: - 'pods' - 'nodes' verbs: - 'get' - 'list' - 'watch' ports: promexporter: enabled: true containerPort: 9099 servicePort: 9099 protocol: TCP command: extraArgs: - "--feature-gates=receiver.prometheusreceiver.EnableNativeHistograms" config: receivers: prometheus/kgateway-dataplane: config: global: scrape_protocols: [ PrometheusProto, OpenMetricsText1.0.0, OpenMetricsText0.0.1, PrometheusText0.0.4 ] scrape_configs: # Scrape the kgateway proxy pods - job_name: kgateway-gateways honor_labels: true kubernetes_sd_configs: - role: pod relabel_configs: - action: keep regex: kube-gateway source_labels: - __meta_kubernetes_pod_label_kgateway - source_labels: [__meta_kubernetes_pod_annotation_prometheus_io_scrape] action: keep regex: true - source_labels: [__meta_kubernetes_pod_annotation_prometheus_io_path] action: replace target_label: __metrics_path__ regex: (.+) - action: replace source_labels: - __meta_kubernetes_pod_ip - __meta_kubernetes_pod_annotation_prometheus_io_port separator: ':' target_label: __address__ - action: labelmap regex: __meta_kubernetes_pod_label_(.+) - source_labels: [__meta_kubernetes_namespace] action: replace target_label: kube_namespace - source_labels: [__meta_kubernetes_pod_name] action: replace target_label: pod prometheus/kgateway-controlplane: config: global: scrape_protocols: [ PrometheusProto, OpenMetricsText1.0.0, OpenMetricsText0.0.1, PrometheusText0.0.4 ] scrape_configs: # Scrape the kgateway controlplane pods - job_name: kgateway-controlplane honor_labels: true kubernetes_sd_configs: - role: pod relabel_configs: - action: keep regex: kgateway source_labels: - __meta_kubernetes_pod_label_kgateway - source_labels: [__meta_kubernetes_pod_annotation_prometheus_io_scrape] action: keep regex: true - source_labels: [__meta_kubernetes_pod_annotation_prometheus_io_path] action: replace target_label: __metrics_path__ regex: (.+) - action: replace source_labels: - __meta_kubernetes_pod_ip - __meta_kubernetes_pod_annotation_prometheus_io_port separator: ':' target_label: __address__ - action: labelmap regex: __meta_kubernetes_pod_label_(.+) - source_labels: [__meta_kubernetes_namespace] action: replace target_label: kube_namespace - source_labels: [__meta_kubernetes_pod_name] action: replace target_label: pod exporters: prometheus: endpoint: 0.0.0.0:9099 prometheusremotewrite/kube-prometheus-stack: endpoint: http://kube-prometheus-stack-prometheus.telemetry.svc:9090/api/v1/write debug: verbosity: detailed service: pipelines: metrics: receivers: [prometheus/kgateway-dataplane, prometheus/kgateway-controlplane] processors: [batch] exporters: [debug, prometheusremotewrite/kube-prometheus-stack] EOF -
Deploy the logs collector to process and forward application logs.
helm upgrade --install opentelemetry-collector-logs opentelemetry-collector \ --repo https://open-telemetry.github.io/opentelemetry-helm-charts \ --version 0.127.2 \ --set mode=deployment \ --set image.repository="otel/opentelemetry-collector-contrib" \ --set command.name="otelcol-contrib" \ --namespace=telemetry \ --create-namespace \ -f -<<EOF config: receivers: otlp: protocols: grpc: endpoint: 0.0.0.0:4317 http: endpoint: 0.0.0.0:4318 exporters: otlphttp/loki: endpoint: http://loki.telemetry.svc.cluster.local:3100/otlp tls: insecure: true debug: verbosity: detailed service: pipelines: logs: receivers: [otlp] processors: [batch] exporters: [debug, otlphttp/loki] EOF -
Deploy the traces collector to handle distributed tracing data.
helm upgrade --install opentelemetry-collector-traces opentelemetry-collector \ --repo https://open-telemetry.github.io/opentelemetry-helm-charts \ --version 0.127.2 \ --set mode=deployment \ --set image.repository="otel/opentelemetry-collector-contrib" \ --set command.name="otelcol-contrib" \ --namespace=telemetry \ --create-namespace \ -f -<<EOF config: receivers: otlp: protocols: grpc: endpoint: 0.0.0.0:4317 http: endpoint: 0.0.0.0:4318 exporters: otlp/tempo: endpoint: http://tempo.telemetry.svc.cluster.local:4317 tls: insecure: true debug: verbosity: detailed service: pipelines: traces: receivers: [otlp] processors: [batch] exporters: [debug, otlp/tempo] EOF -
Verify that the OpenTelemetry collector pods are running.
kubectl get pods -n telemetry -l app.kubernetes.io/name=opentelemetry-collectorExample output:
NAME                                               READY   STATUS    RESTARTS   AGE
opentelemetry-collector-logs-676777487b-wbtkj      1/1     Running   0          56s
opentelemetry-collector-metrics-6cdbc47594-mfrzs   1/1     Running   0          69s
opentelemetry-collector-traces-7696858cf9-tjllx    1/1     Running   0          51s
Step 3: Set up Prometheus
Prometheus is a monitoring system and time-series database that collects metrics from configured targets at given intervals. It’s the de facto standard for metrics collection in cloud-native environments. You can use the PromQL query language to set up flexible queries and alerts based on the metrics.
-
Deploy Prometheus in your cluster.
helm upgrade --install kube-prometheus-stack kube-prometheus-stack \ --repo https://prometheus-community.github.io/helm-charts \ --version 75.6.1 \ --namespace telemetry \ --create-namespace \ --values - <<EOF alertmanager: enabled: false prometheus: prometheusSpec: ruleSelectorNilUsesHelmValues: false serviceMonitorSelectorNilUsesHelmValues: false podMonitorSelectorNilUsesHelmValues: false enableFeatures: - native-histograms enableRemoteWriteReceiver: true grafana: enabled: true defaultDashboardsEnabled: true datasources: datasources.yaml: apiVersion: 1 datasources: - name: Prometheus type: prometheus uid: prometheus access: proxy orgId: 1 url: http://kube-prometheus-stack-prometheus.telemetry:9090 basicAuth: false editable: true jsonData: httpMethod: GET exemplarTraceIdDestinations: - name: trace_id datasourceUid: tempo - name: Tempo type: tempo access: browser basicAuth: false orgId: 1 uid: tempo url: http://tempo.telemetry.svc.cluster.local:3100 isDefault: false editable: true - orgId: 1 name: Loki type: loki typeName: Loki access: browser url: http://loki.telemetry.svc.cluster.local:3100 basicAuth: false isDefault: false editable: true EOF -
Verify that the Prometheus stack’s components are up and running.
kubectl get pods -n telemetry -l app.kubernetes.io/instance=kube-prometheus-stackExample output:
NAME                                                        READY   STATUS    RESTARTS   AGE
kube-prometheus-stack-grafana-b546d7755-ks7sn               3/3     Running   0          72s
kube-prometheus-stack-kube-state-metrics-684f8c7558-xhn2p   1/1     Running   0          72s
kube-prometheus-stack-operator-6dc9c666c5-pwzkb             1/1     Running   0          72s
kube-prometheus-stack-prometheus-node-exporter-z7csm        1/1     Running   0          72s
Step 4: Configure telemetry policies
Now that you have the telemetry stack set up, you can configure the telemetry policies to collect logging and tracing data for your gateway environment. The HTTPListenerPolicy lets you configure how to collect, process, and route logs and traces for your Gateway or ListenerSet resources. Note that metrics are collected automatically.
-
Create an HTTPListenerPolicy to collect and store logs in Loki. The policy applies to the
httpGateway that serves traffic to thehttpbinapp that you set up before you began.kubectl apply -f- <<EOF apiVersion: gateway.kgateway.dev/v1alpha1 kind: HTTPListenerPolicy metadata: name: logging-policy namespace: kgateway-system spec: targetRefs: - group: gateway.networking.k8s.io kind: Gateway name: http accessLog: - openTelemetry: grpcService: backendRef: name: opentelemetry-collector-logs namespace: telemetry port: 4317 logName: "http-gateway-access-logs" body: >- "%REQ(:METHOD)% %REQ(X-ENVOY-ORIGINAL-PATH?:PATH)% %RESPONSE_CODE% "%REQ(:AUTHORITY)%" "%UPSTREAM_CLUSTER%"' EOF -
Create a Kubernetes ReferenceGrant so that the HTTPListenerPolicy can apply to the OTel logs collector service.
kubectl apply -f- <<EOF apiVersion: gateway.networking.k8s.io/v1beta1 kind: ReferenceGrant metadata: name: allow-otel-collector-logs-access namespace: telemetry spec: from: - group: gateway.kgateway.dev kind: HTTPListenerPolicy namespace: kgateway-system to: - group: "" kind: Service name: opentelemetry-collector-logs EOF -
Create another HTTPListenerPolicy to collect and store traces in Tempo.
kubectl apply -f- <<EOF apiVersion: gateway.kgateway.dev/v1alpha1 kind: HTTPListenerPolicy metadata: name: tracing-policy namespace: kgateway-system spec: targetRefs: - group: gateway.networking.k8s.io kind: Gateway name: http tracing: provider: openTelemetry: serviceName: http grpcService: backendRef: name: opentelemetry-collector-traces namespace: telemetry port: 4317 spawnUpstreamSpan: true EOF -
Create a Kubernetes ReferenceGrant so that the HTTPListenerPolicy can apply to the OTel traces collector service.
kubectl apply -f- <<EOF
apiVersion: gateway.networking.k8s.io/v1beta1
kind: ReferenceGrant
metadata:
  name: allow-otel-collector-traces-access
  namespace: telemetry
spec:
  from:
  - group: gateway.kgateway.dev
    kind: HTTPListenerPolicy
    namespace: kgateway-system
  to:
  - group: ""
    kind: Service
    name: opentelemetry-collector-traces
EOF
Step 5: Verify your setup
To verify that your setup is working, generate sample traffic and review the logs and Grafana dashboard.
-
Generate traffic for the httpbin app.
for i in {1..5}; do curl -v http://$INGRESS_GW_ADDRESS:8080/status/418 -H "host: www.example.com:8080"; donefor i in {1..5}; do curl -v localhost:8080/status/418 -H "host: www.example.com:8080"; doneExample output:
< HTTP/1.1 418 Unknown I'm a teapot! ... -
Check that logs are being collected.
kubectl -n telemetry logs deploy/opentelemetry-collector-logs | grep '/status/418' | wc -lExample output: The count matches the number of requests that you sent, such as
5.5 -
Check that traces are being collected.
kubectl -n telemetry logs deploy/opentelemetry-collector-traces | grep 'http.status_code: Str(418)' | wc -lExample output: The count traces the number of services that were involved in responding to the request, such as
10.10 -
Verify that data plane metrics for the gateway proxy are being collected by using a Grafana dashboard.
-
Create a Grafana dashboard for the data plane metrics of your gateway proxy. For example, you can download the sample Grafana dashboard configuration for the
httpgateway as anenvoy.jsonfile. -
Import the Grafana dashboard.
kubectl -n telemetry create cm envoy-dashboard \ --from-file=envoy.json kubectl label -n telemetry cm envoy-dashboard grafana_dashboard=1 -
Open and log in to Grafana by using the username
adminand passwordprom-operator.open "http://$(kubectl -n telemetry get svc kube-prometheus-stack-grafana -o jsonpath="{.status.loadBalancer.ingress[0]['hostname','ip']}"):3000"- Port-forward the Grafana service to your local machine.
kubectl port-forward deployment/kube-prometheus-stack-grafana -n telemetry 3000 - Open Grafana in your browser by using the following URL: http://localhost:3000
- Port-forward the Grafana service to your local machine.
-
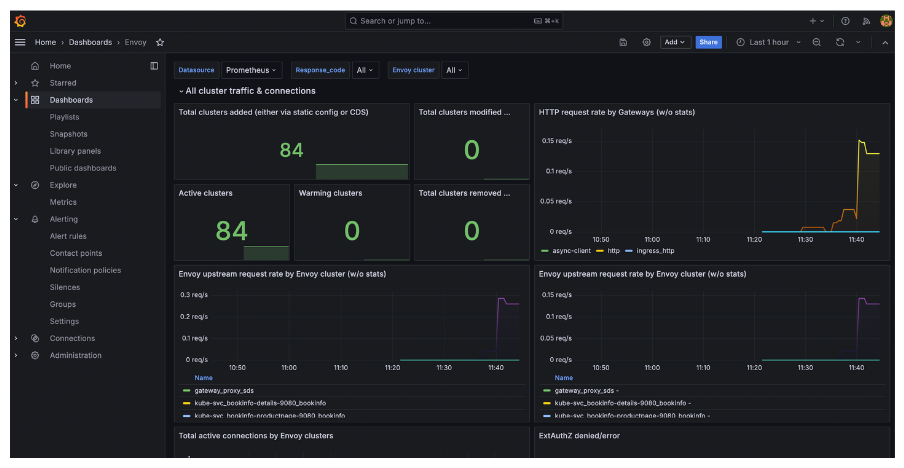
Go to Dashboards > Envoy to open the dashboard that you imported. Verify that you see the traffic that you generated for the httpbin app.
-
Cleanup
You can remove the resources that you created in this guide.-
Remove the configmap for the Envoy gateway proxy dashboard and delete the
envoy.jsonfile.kubectl delete cm envoy-dashboard -n telemetry rm envoy.json -
Delete the HTTPListenerPolicy policies that collect logs and traces.
kubectl delete httplistenerpolicy logging-policy -n kgateway-system kubectl delete httplistenerpolicy tracing-policy -n kgateway-system -
Uninstall the Grafana Loki and Tempo components.
helm uninstall loki -n telemetry helm uninstall tempo -n telemetry -
Uninstall the OpenTelemetry collectors.
helm uninstall opentelemetry-collector-metrics -n telemetry helm uninstall opentelemetry-collector-logs -n telemetry helm uninstall opentelemetry-collector-traces -n telemetry -
Uninstall the Prometheus stack.
helm uninstall kube-prometheus-stack -n telemetry -
Remove the
telemetrynamespace.kubectl delete namespace telemetry