Debug your setup
Use built-in tools to troubleshoot issues in your kgateway setup.
Kgateway is based on Envoy proxy. If you experience issues in your environment, such as policies that are not applied or traffic that is not routed correctly, in a lot of cases, these errors can be observed at the proxy. In this guide you learn how to use the kgateway and Envoy debugging tools to troubleshoot misconfigurations on the gateway.
Debug your gateway setup
-
Make sure that the kgateway control plane and gateway proxies are running. For any pod that is not running, describe the pod for more details.
kubectl get pods -n kgateway-system -
Check the HTTPRoutes for the status of the route and any attached policies.
kubectl get httproutes -Akubectl get httproute <name> -n <namespace> -o yaml -
Access the debugging interface of your gateway proxy on your localhost. Configuration might be missing on the gateway or might be applied to the wrong route. For example, if you apply multiple policies to the same route by using the
targetRefssection, only the oldest policy is applied. The newer policy configuration might be ignored and not applied to the gateway.kubectl port-forward deploy/http -n kgateway-system 19000 &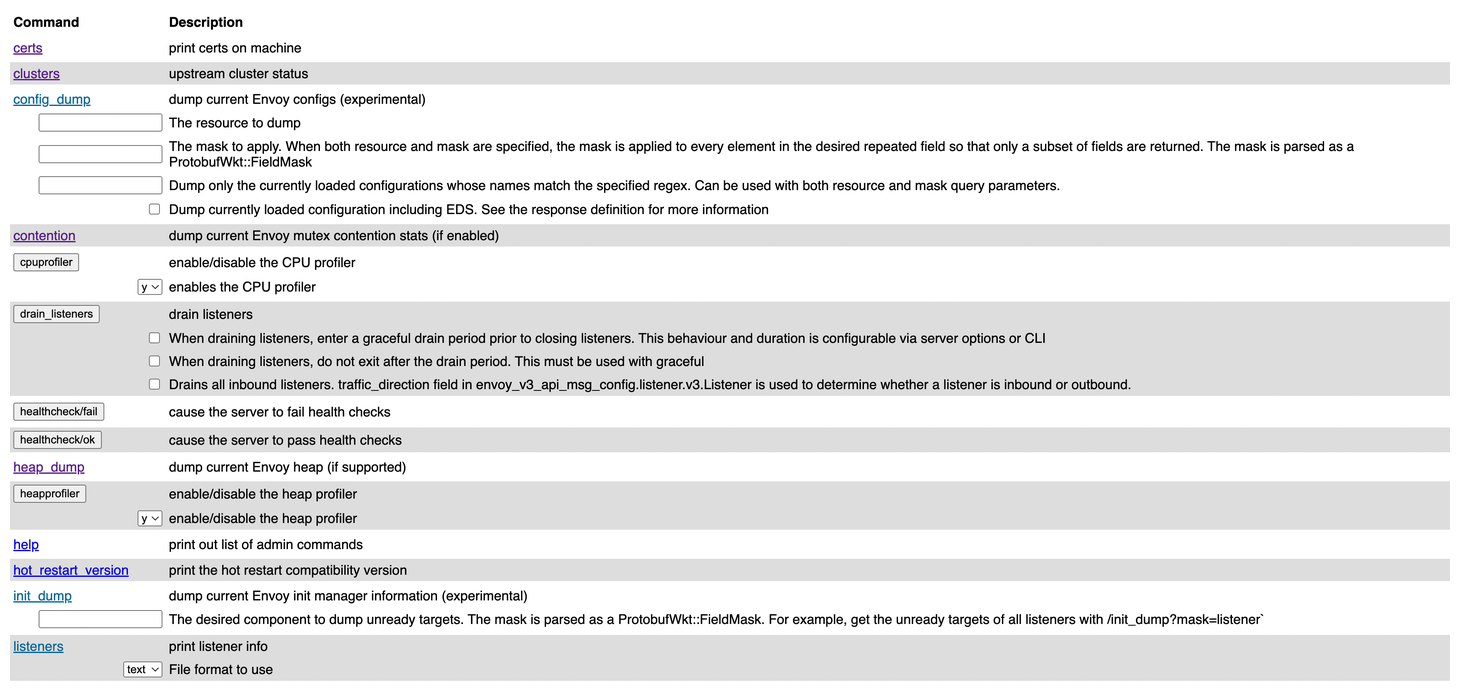
Figure: Debugging interface of the gateway proxy. Figure: Debugging interface of the gateway proxy. Common endpoints that can help troubleshoot your setup further, include:
Endpoint Description config_dump Get the configuration that is available in the Envoy proxy. Any kgateway resources that you create are translated in to Envoy configuration. Depending on whether or not you enabled resource validation, you might have applied invalid configuration that is rejected Envoy. You can also use glooctl proxy dumpto get the Envoy proxy configuration.listeners See the listeners that are configured on your gateway. logging Review the log level that is set for each component. stats/prometheus View metrics that Envoy emitted and sent to the built-in Prometheus instance. -
Review the logs for each component. Each component logs the sync loops that it runs, such as syncing with various environment signals like the Kubernetes API. You can fetch the latest logs for all the components with the following command.
# kgateway control plane
kubectl logs -n kgateway-system deployment/kgateway

# Replace $GATEWAY_NAME with the name of your gateway.
export GATEWAY_NAME=http
kubectl logs -n kgateway-system deployment/$GATEWAY_NAME
TrafficPolicy not applied
As part of debugging, you might have noticed that your HTTPRoute or Gateway had an attached TrafficPolicy. The TrafficPolicy’s status might say Accepted and seem normal. However, when you checked the gateway configuration, the policy is not applied to the selected routes. Review the following common reasons for missing policies.
-
Verify that the TrafficPolicy is attached correctly. For example, you might use label selectors that do not match any HTTPRoute or Gateway. For more information, see Policy attachment.
-
Confirm that you do not have multiple, conflicting policies. In general, the oldest policy is enforced. For more information, see Policy priority and merging rules.
-
Determine if you need a Kubernetes ReferenceGrant. For example, the TrafficPolicy might rely on a GatewayExtension to enable a feature such as external auth. However, the GatewayExtension might be in a different namespace than the backing external auth service.
Example ReferenceGrant for external auth GatewayExtension:
- The GrantExtension for external auth, HTTPRoute, and backing Service are in the app namespace, such as
httpbin. - The external auth service is in the
kgateway-systemnamespace.
apiVersion: gateway.networking.k8s.io/v1beta1 kind: ReferenceGrant metadata: name: reference-grant namespace: kgateway-system spec: from: - group: gateway.kgateway.dev kind: GatewayExtension namespace: httpbin to: - group: "" kind: Service - The GrantExtension for external auth, HTTPRoute, and backing Service are in the app namespace, such as